
#Read an instance's details
Monitoring & logs lists the runs of your processes with their state, and each run's page shows the path it took, what every step received and produced, and why a step failed.
#Find a run
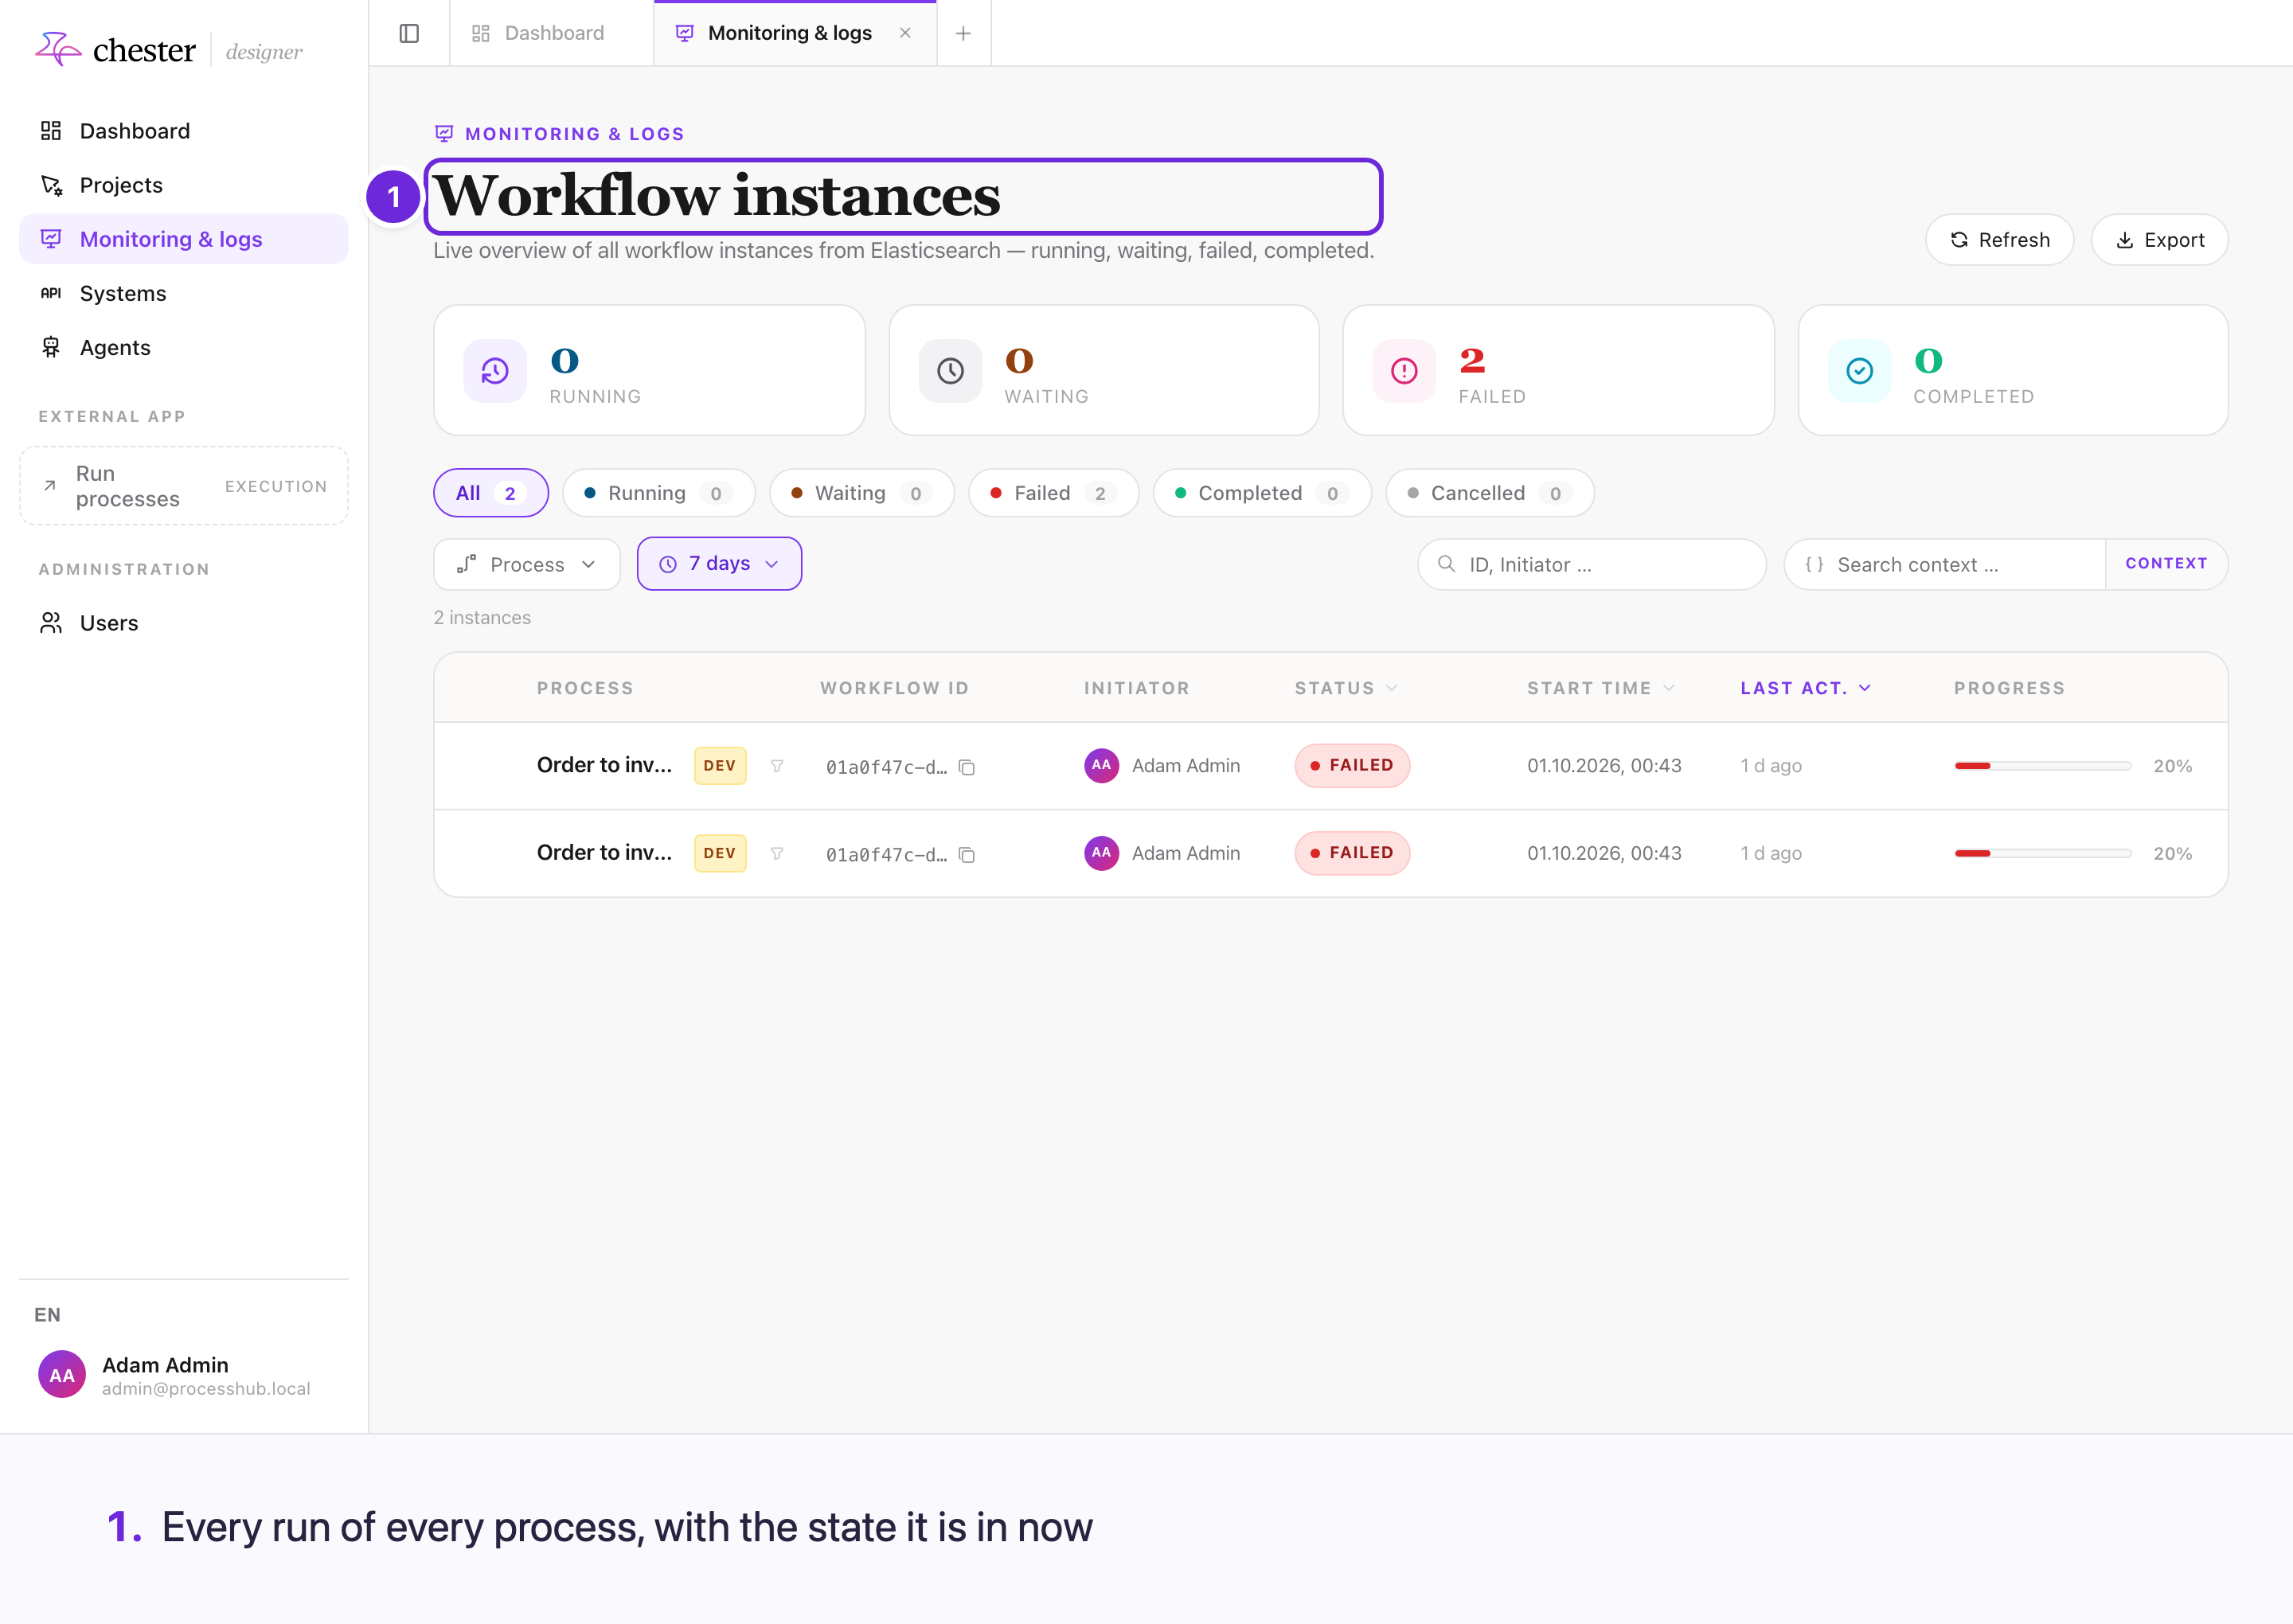
Open Monitoring & logs in the Designer:
- The counters and tabs filter by state: All, Running, Waiting, Failed, Completed, Cancelled.
- Process narrows the list to some processes; the time range — 7 days unless changed — goes by each run's last activity.
- ID, Initiator … finds a run by its id or by who started it; Search context … finds runs by the data their steps produced.
- Runs of a development deployment carry a DEV badge.
- Refresh switches to live mode and updates the list every 5 seconds. Export saves the rows loaded so far as a CSV file.
⚠️ Runs started by another run — a sub-process, a call activity, an agent's tool — are not listed on their own. Expand their parent's row to see them.
#What a run's page shows
flowchart TB
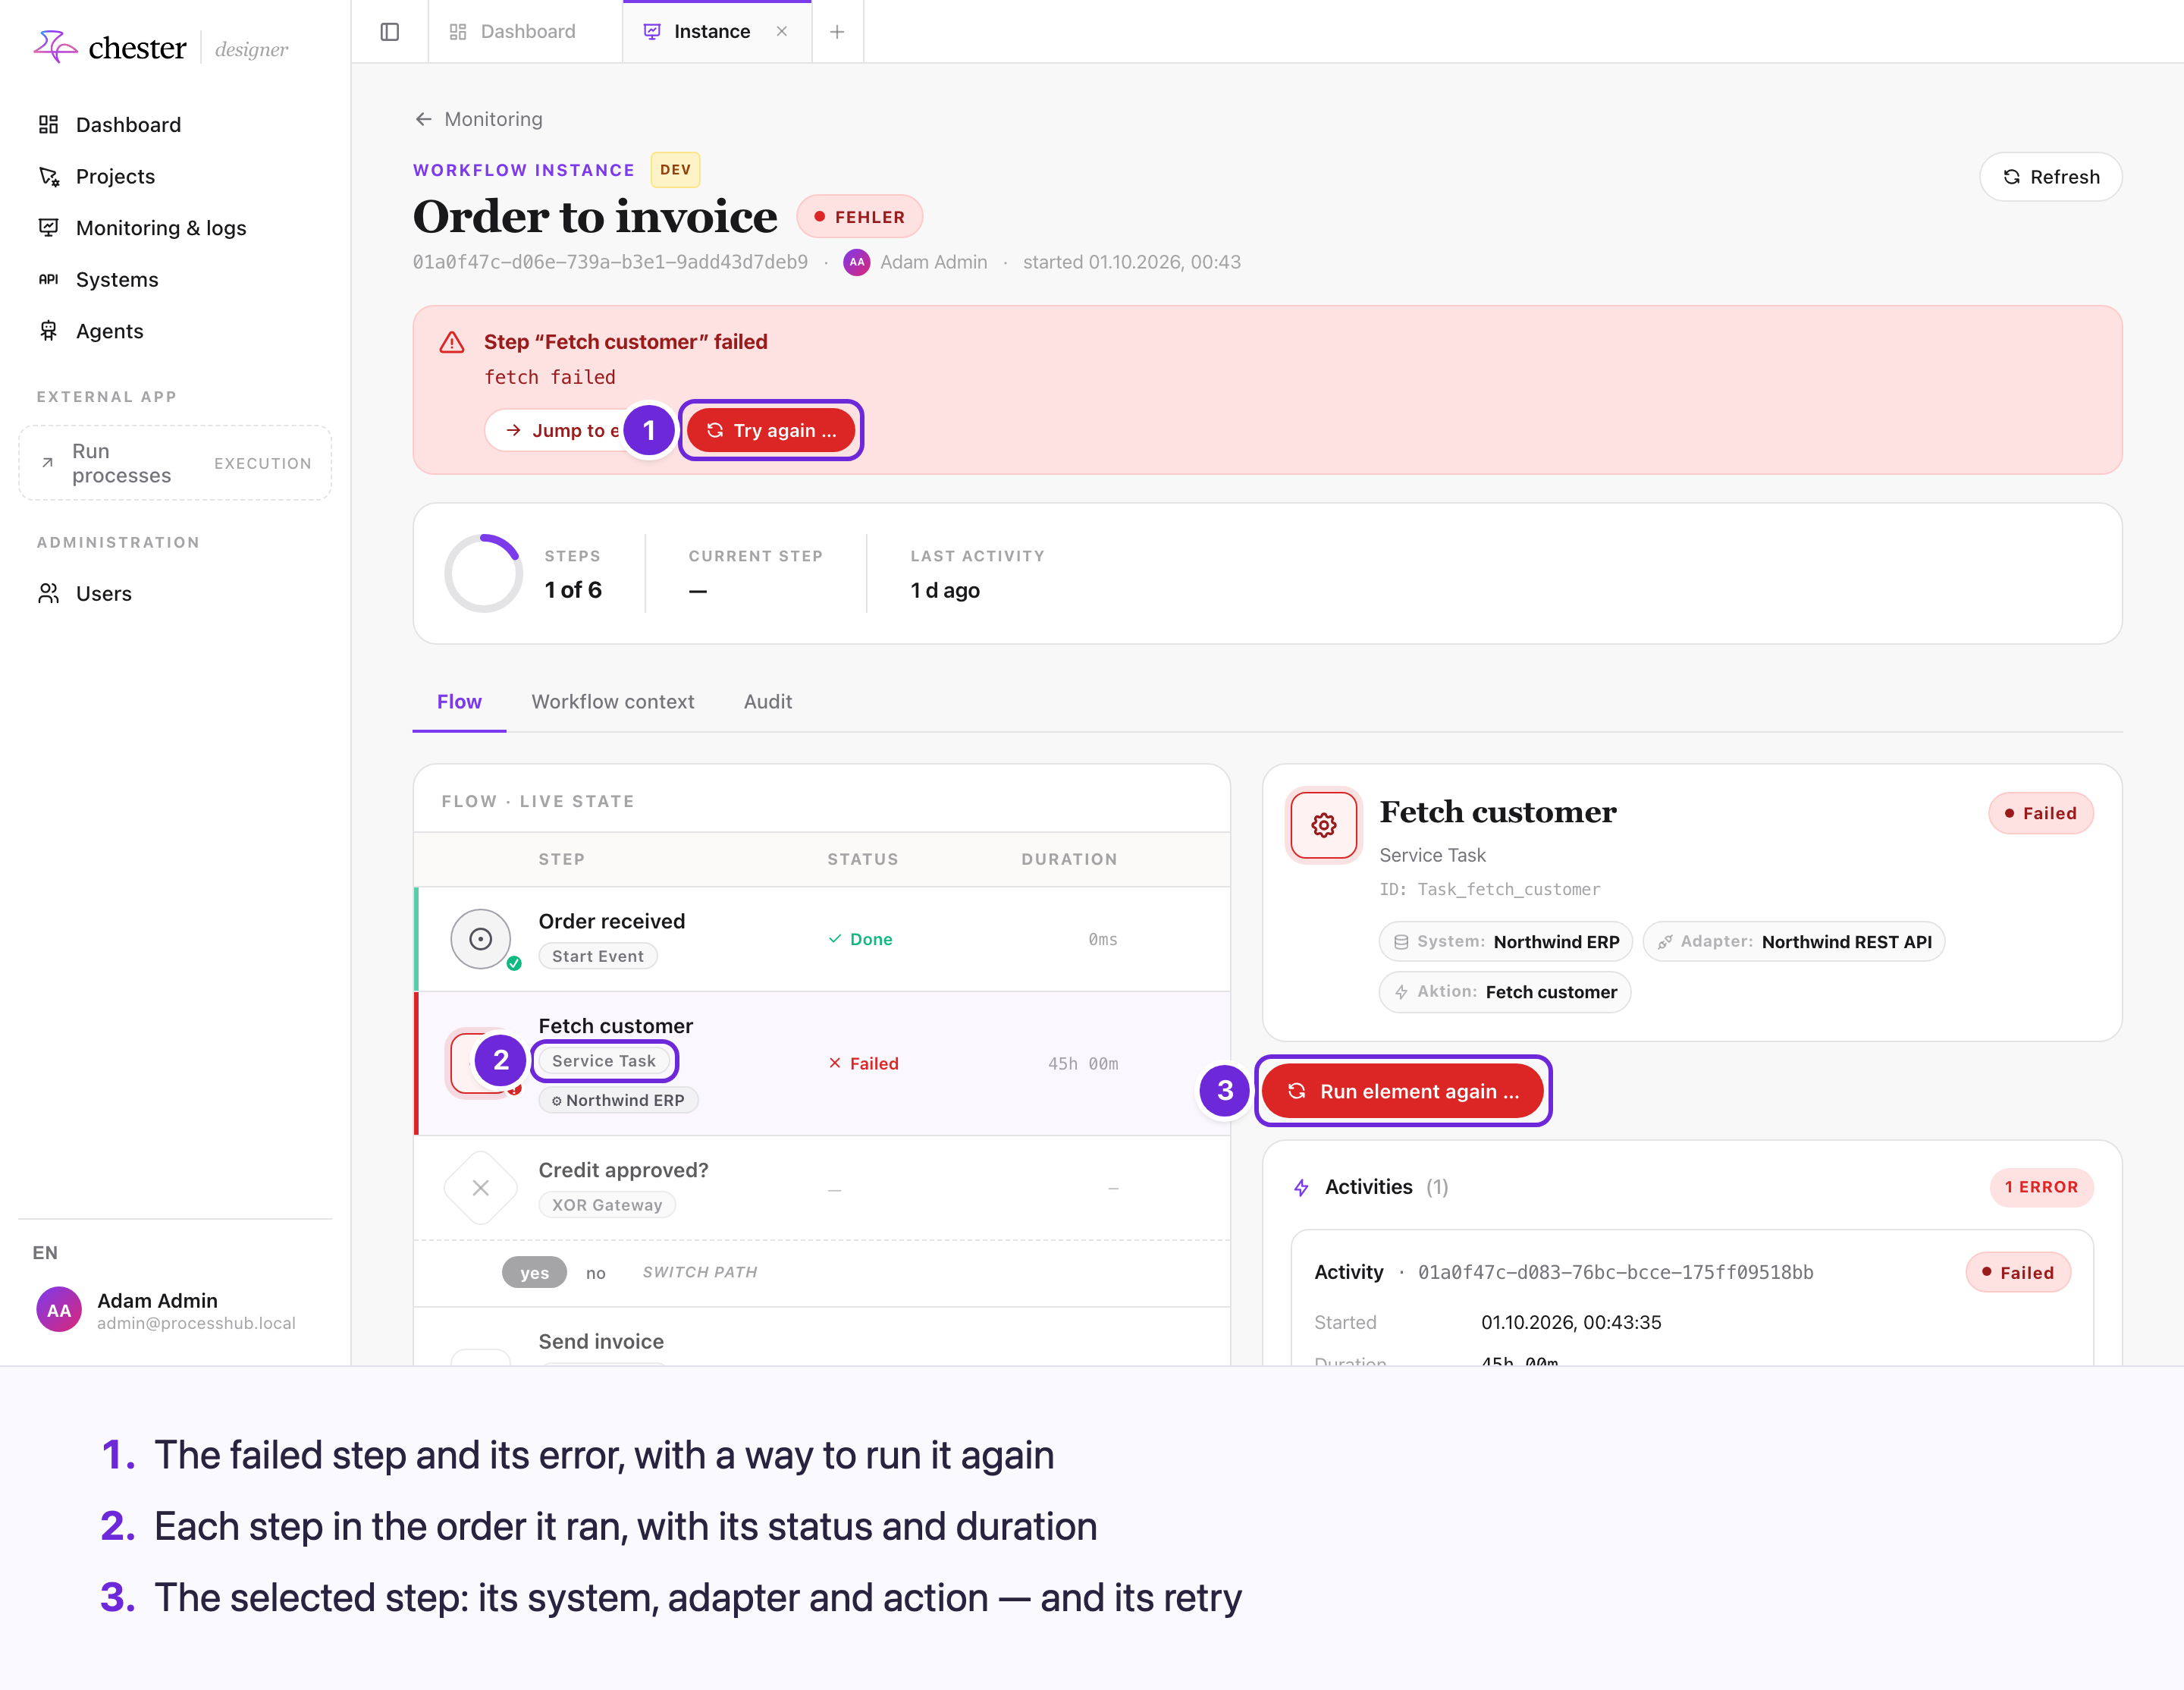
  H["Header: process, status, id,<br/>who started it and when"] --> E["Error banner — only if failed:<br/>Jump to error · Try again …"]
  E --> P["Progress: steps done, current step,<br/>last activity"]
  P --> T{"Tabs"}
  T --> F["Flow: every step, its status and duration —<br/>click one for its details"]
  T --> C["Workflow context: what each<br/>finished step produced"]
  T --> A["Audit: metadata of the run"]
#Flow
The left side lists the steps in the order the run reached them, with their status and duration. Steps inside a sub-process, a call activity or an agent are indented and smaller, joined to their parent by a thin tree line. A sub-process the run failed in or is still inside of starts expanded; a finished one starts collapsed — the chevron on its row toggles it. A step that runs several times — multi-instance, or an agent's repeated tool — gets an Activity pager. A sequential multi-instance step also shows how many of its runs are done out of the whole list, for example 2 of 5; its pager lists the runs that have not started yet as dashed numbers you cannot open yet. A run that was dropped without running, for example because the step was interrupted at the same moment, is marked Skipped and no longer counts as running.
The list shows the path of this run, not the whole template: of several start events only the one that fired appears, together with its branch, and an error boundary event with its handler steps appears only once it has caught an error. Steps the run has not reached yet but can still reach stay listed without a status. The Process view of a process shows the full template.
Clicking a step opens its card on the right:
- its type, id and, for a system call, System, Adapter and action;
- Activities: when each run of the step started and ended, and its error;
- Input: what the step received, with Evaluated and Expression views;
- Output: what it produced;
- for an agent, its conversation — see Follow what an agent did in a run.
#Workflow context
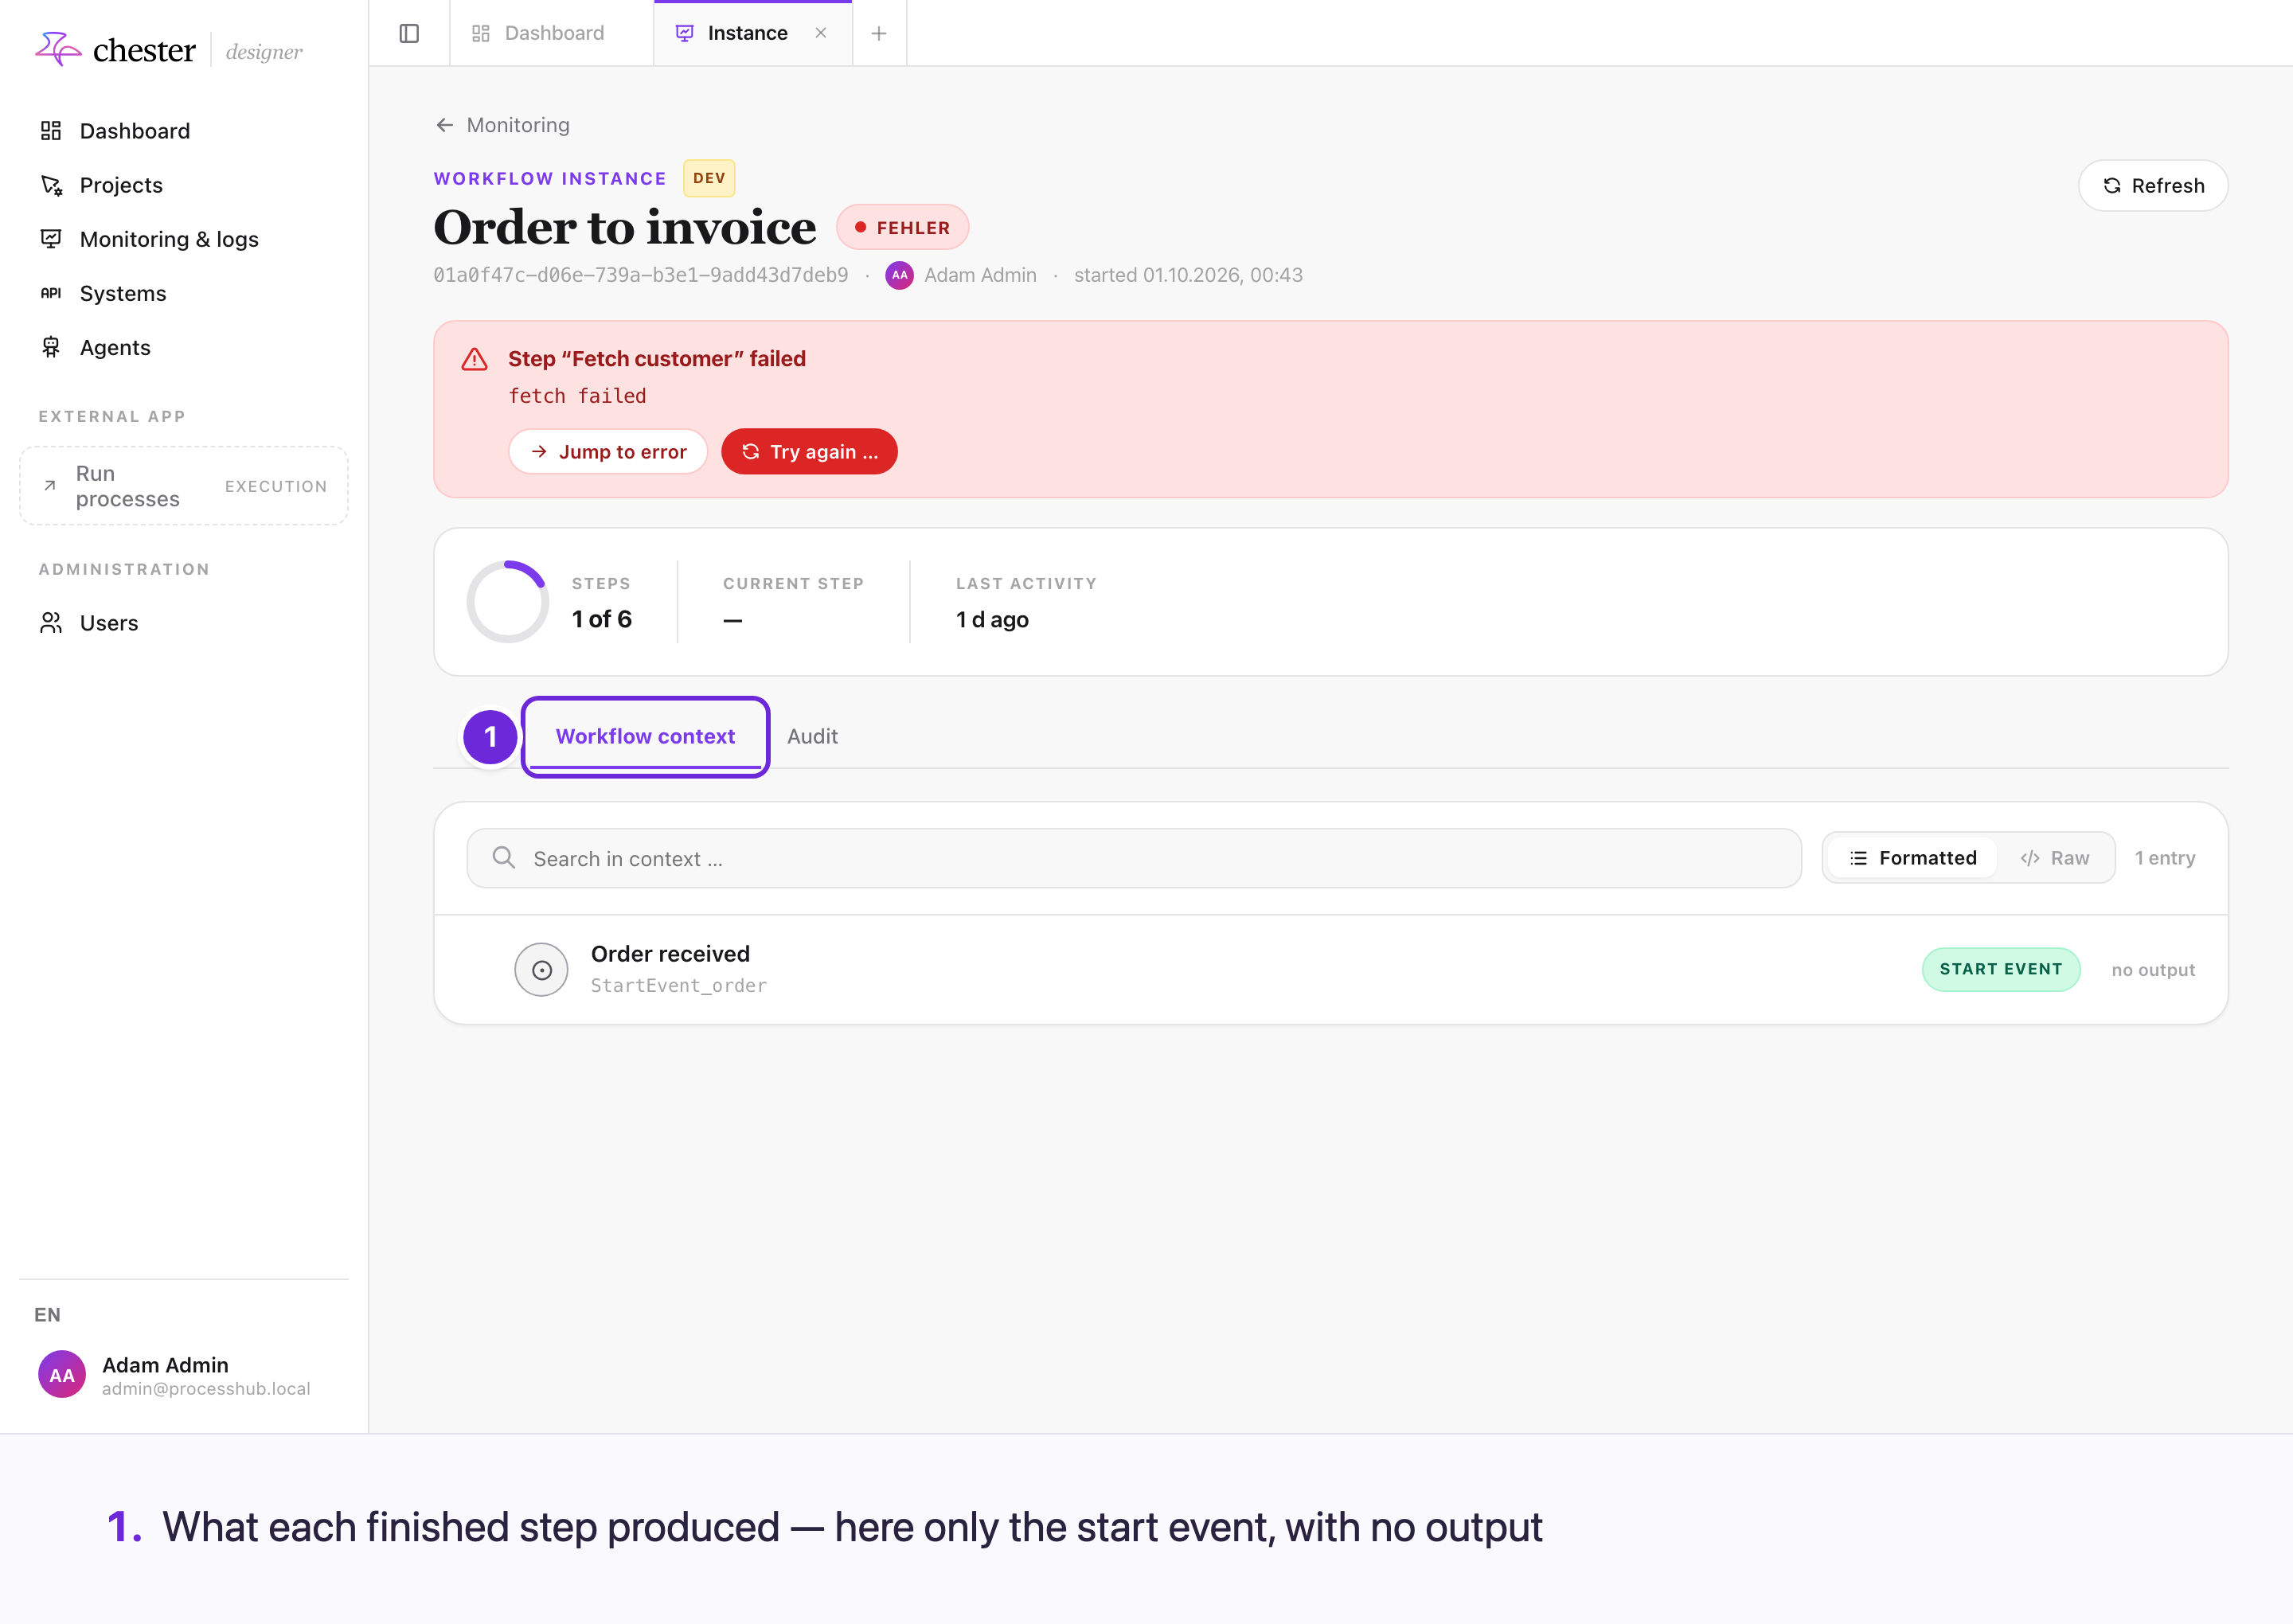
One entry per step that produced something, with what it produced. Formatted and Raw switch the view; Search in context … searches the values.
#Audit
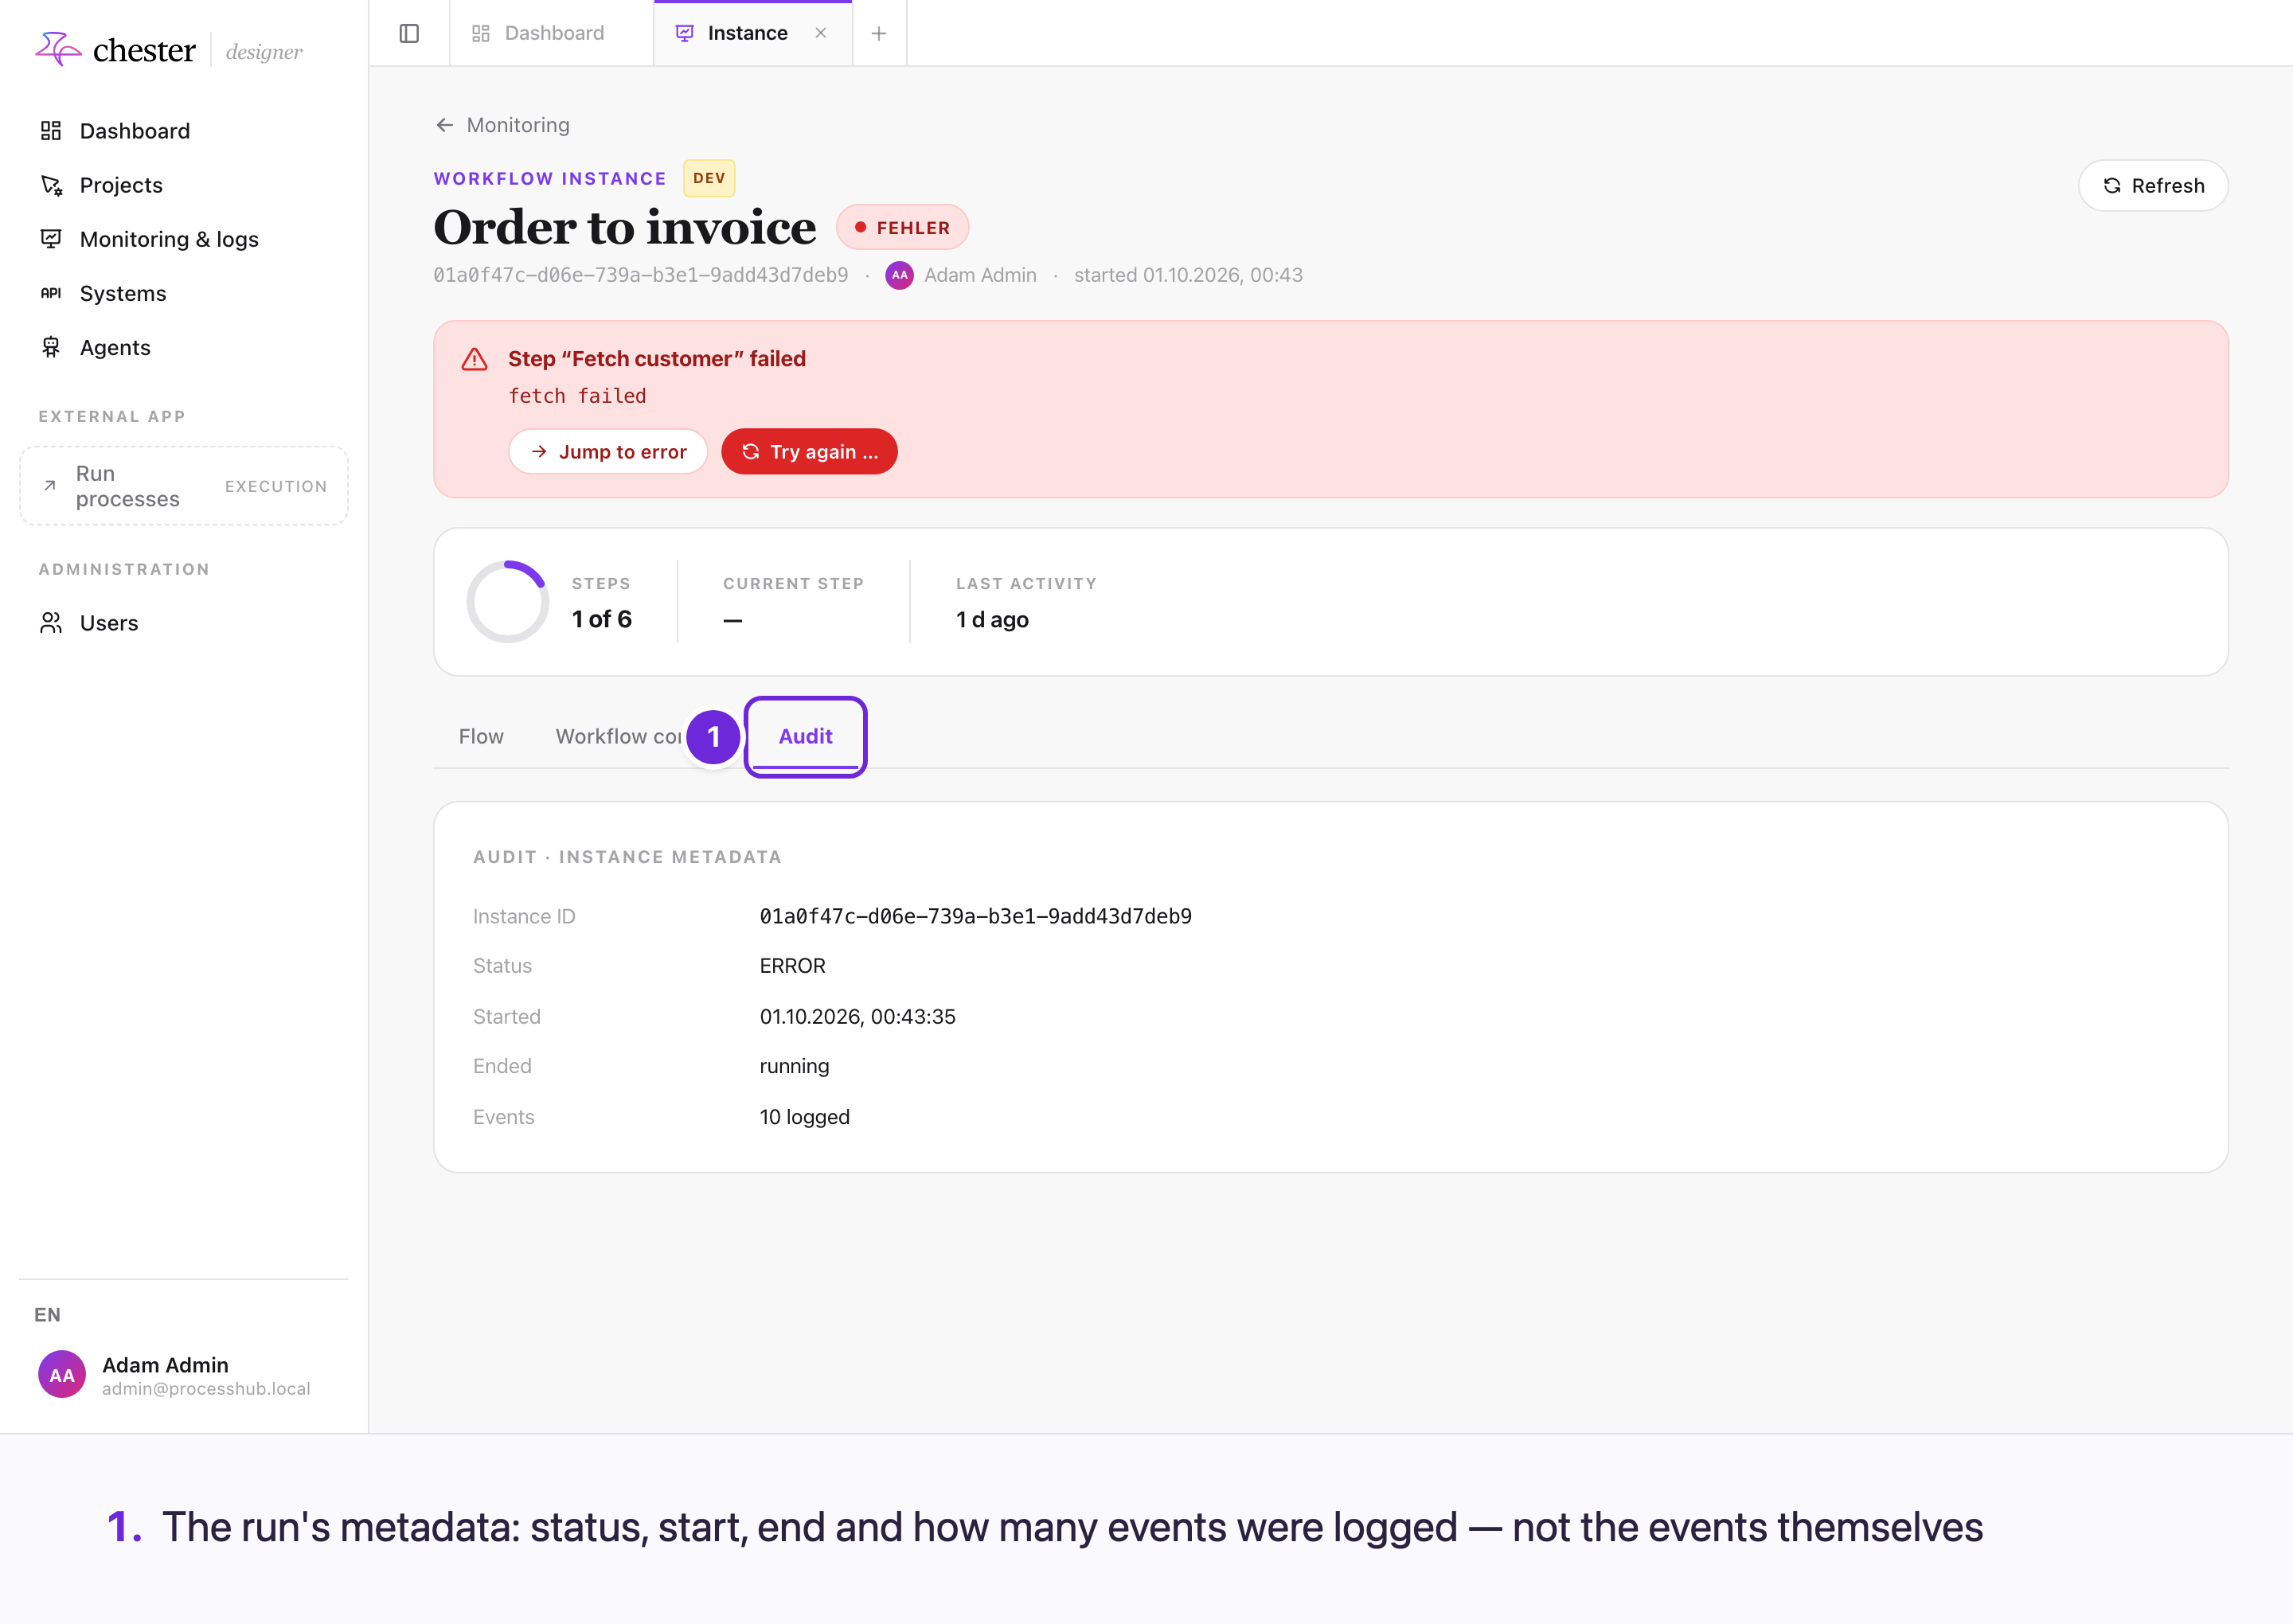
The run's id, its status, start and end, and how many events the engine logged.
⚠️ The events themselves are not listed, and neither are the retries people made.
#Limits
- ⚠️ The number of automatic retries of a step is not shown.
- ⚠️ An error in an expression is shown as the raw technical message.
- ⚠️ A failed step's duration keeps counting after it failed.
- ⚠️ A run with more than 1000 events may be shown incompletely; the page says so.
- ⚠️ Some labels are German whatever the language of the screen — the status FEHLER in the header, Aktion on the step card — and dates use the German format.
- Runs are listed for everyone who can open the Designer; there is no restriction by process.